


1. Introduction
2. Driver-in-the-Loop Interpretation Framework
2.1. From Tire Force Estimation to Tire Utilization Interpretation
2.2. Internal Representation of Vehicle Dynamics
2.3. Interpreting Tire Utilization Characteristics
3. Pilot Study
3.1. Experimental Data
3.2. Interpretation Procedure
4. Understanding High-Skilled Driving Through Tire Utilization Characteristics
4.1. Trajectory and Speed Characteristics
4.2. Acceleration Transition from Corner Entry through Re-acceleration to Corner Exit
4.3. Tire Utilization Characteristics in g-g Space
4.4. Tire Utilization as a Build-Up Strategy for Corner Exit
5. Discussion
1. Introduction
Understanding human driving behavior has become increasingly important for advanced driver assistance systems, automated driving, and human-centered vehicle technologies. In particular, highly skilled drivers have attracted considerable attention because they are capable of maintaining superior performance under dynamic and uncertain driving conditions. In motorsports and other high-demand driving environments, expert drivers consistently demonstrate faster lap times, improved vehicle stability, and greater adaptability compared with less experienced drivers. Traditionally, driving skills have often been evaluated using performance-oriented metrics such as lap time, trajectory tracking accuracy, vehicle stability, or control smoothness. While these measures are useful for quantifying driving outcomes, they do not fully explain why highly skilled drivers are able to achieve superior performance. Similar observations have been reported in studies of expert human performance, where expertise is increasingly viewed not merely as a result of repeated practice but as the acquisition of knowledge and strategies that enable effective decision-making and action under complex conditions.(1)
From this perspective, highly skilled driving should be understood not only as a control outcome but also as a result of experience-based understanding developed through repeated interaction with vehicles and driving environments. This viewpoint is particularly relevant to recent research efforts in driver modeling, driving simulation, and autonomous driving, where understanding expert behavior has become as important as reproducing observable driving actions. Previous studies have investigated driver behavior through trajectory analysis, behavior modeling, and simulation-based approaches, demonstrating the potential of human driving data for intelligent vehicle systems and automated driving applications.(2) However, these approaches have primarily focused on observable driving behavior, while the vehicle-dynamics-related characteristics underlying high-skilled driving require further investigation.
Despite these efforts, a fundamental question remains largely unanswered: what knowledge enables highly skilled drivers to operate vehicles effectively near their handling limits? Addressing this question requires moving beyond observable driving outcomes toward the mechanisms that support expert performance.
Research on skilled human performance suggests that expertise is acquired not only through repeated practice but also through the development of internal representations that support prediction, decision-making, and control.(1,3~5) In motor control, humans have been shown to acquire representations of dynamic systems through repeated sensorimotor interaction, allowing them to anticipate system responses and adapt their behavior accordingly.(3~5) Oulasvirta et al.(6) further argued that human behavior can be understood as rational adaptation under constraints of information and cognition, implying that effective performance may rely on simplified yet functional representations rather than explicit physical models. For complex dynamic tasks involving partially observable system states, such representations provide a basis for perception, anticipation, and action. Following this perspective, the present study investigates whether highly skilled driving behavior may reflect internal representations of vehicle dynamics acquired through repeated interaction with vehicles and driving environments.
Driving can be viewed as a human-in-the-loop control task in which drivers continuously interact with vehicle dynamics through steering, throttle, and braking inputs while perceiving vehicle responses through visual, vestibular, and haptic feedback.(7~9) Although quantities such as tire forces, slip angles, and road friction are not directly observable, highly skilled drivers can operate vehicles near handling limits and adapt to changing driving conditions. In this study, internal representation of vehicle dynamics is used as an interpretive concept for describing the driver’s experience-based understanding of vehicle behavior, rather than as a directly measurable state.
Recent studies have investigated driver behavior through trajectory prediction, behavior modeling, and simulation-based approaches.(9~12) However, these studies have largely focused on comparisons between professional and non-professional drivers, leaving performance-related differences among professional or highly skilled drivers relatively underexplored. Meanwhile, human-centered and human-inspired driving research has emphasized the importance of incorporating human driving strategies into future automated driving systems.(13~16) Vehicle dynamics research has also devoted substantial effort to tire force estimation, friction estimation, and vehicle state estimation.(17~20) However, relatively limited attention has been paid to how highly skilled drivers utilize vehicle dynamic capability during driving. To address this gap, the present study adopts a driver-in-the-loop vehicle dynamics perspective and investigates tire utilization characteristics as observable indicators for interpreting highly skilled driving behavior.
This study aims to improve the understanding of highly skilled driving from a vehicle dynamics perspective. Rather than focusing on trajectory reproduction, behavioral imitation, or tire force estimation, attention is directed toward how vehicle dynamic capability is utilized during driving and how such utilization is reflected in observable vehicle behavior. To this end, longitudinal and lateral acceleration, vehicle trajectories, speed profiles, and g-g diagrams are examined to interpret tire utilization characteristics during driving. An empirical tire utilization envelope based on g-g diagrams is employed as a practical reference for interpreting available vehicle dynamic capability and its utilization.
The main contribution of this study is to interpret performance-related differences among highly skilled drivers from a vehicle-dynamics perspective using observable vehicle-level responses. Unlike conventional g-g diagram or racing-driver analyses, the focus is not on proposing a new g-g method or directly estimating individual tire utilization, but on discussing how available vehicle dynamic capability is organized and utilized during driving. The results suggest that differences in driving performance may be associated with differences in how vehicle dynamic capability is utilized during driving. The findings also provide insights that may be relevant to future studies on driver coaching, human-inspired vehicle control, and expert driver modeling for automated driving applications.
2. Driver-in-the-Loop Interpretation Framework
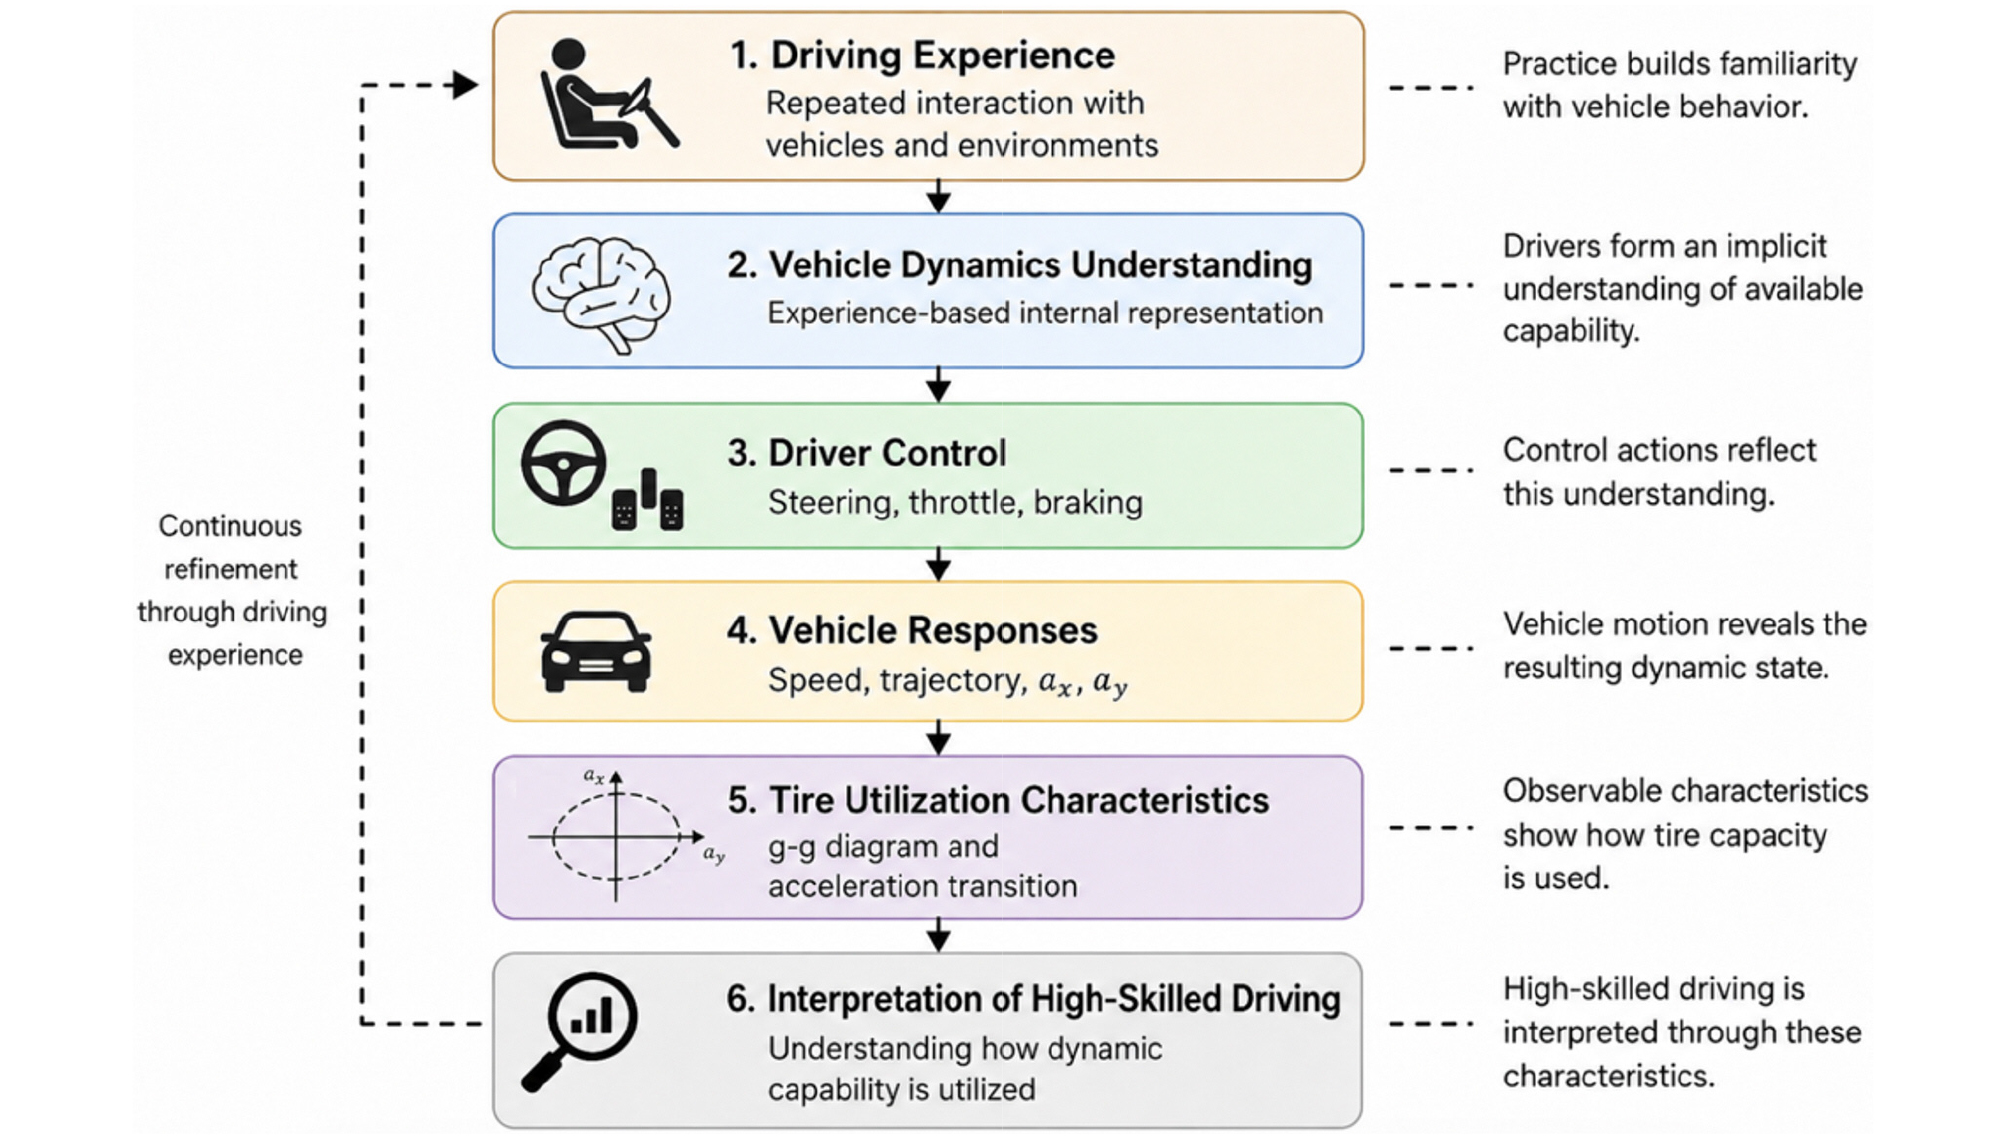
Highly skilled driving involves continuous interaction among the driver, vehicle, and environment. The present study adopts the perspective that observable driving behavior may reflect the driver’s understanding of vehicle dynamic capability developed through repeated driving experience. Since such understanding cannot be directly observed, an indirect interpretation framework is required. This chapter introduces a driver-in-the-loop perspective for examining tire utilization characteristics and their relationship to highly skilled driving behavior. Figure 1 illustrates the conceptual framework adopted in this study.
2.1. From Tire Force Estimation to Tire Utilization Interpretation
Tire forces play a fundamental role in vehicle dynamics and have been extensively studied in the context of vehicle control, state estimation, and automated driving systems. Consequently, considerable effort has been devoted to estimating tire forces, tire-road friction, and related vehicle states. However, such quantities are not directly observable to human drivers during real driving. In addition, the available tire-road friction and resulting vehicle dynamic capability vary continuously with operating conditions, including tire temperature, tire wear, road surface characteristics, and load transfer effects.(18,21) Previous studies have shown that friction-related vehicle performance and control characteristics can change significantly depending on the available tire-road interaction conditions.(21) From a driver perspective, however, the utilization of available vehicle dynamic capability may provide a more interpretable description of driving behavior than the estimation of individual tire forces.
Accordingly, the present study focuses on tire utilization characteristics rather than the estimation of individual tire forces. The objective is not to determine the exact force generated at each tire, but to examine how available vehicle dynamic capability is utilized and reflected in observable driving behavior. This perspective provides a practical means of interpreting highly skilled driving using vehicle-level responses and driver control actions.
2.2. Internal Representation of Vehicle Dynamics
Highly skilled drivers are capable of operating vehicles near handling limits despite having no direct access to tire forces, friction coefficients, or many other vehicle states. This suggests that driving performance depends not only on observable control actions but also on the driver’s understanding of vehicle behavior developed through repeated interaction with vehicles and driving environments.(3~5)
In the present study, the term internal representation of vehicle dynamics is used to describe this experience-based understanding of vehicle behavior, as illustrated in Figure 2. Such representations are not assumed to be explicit vehicle dynamics models or physically accurate descriptions of vehicle states. Instead, they refer to the driver’s practical understanding of how the vehicle is likely to respond under different driving conditions.(6)
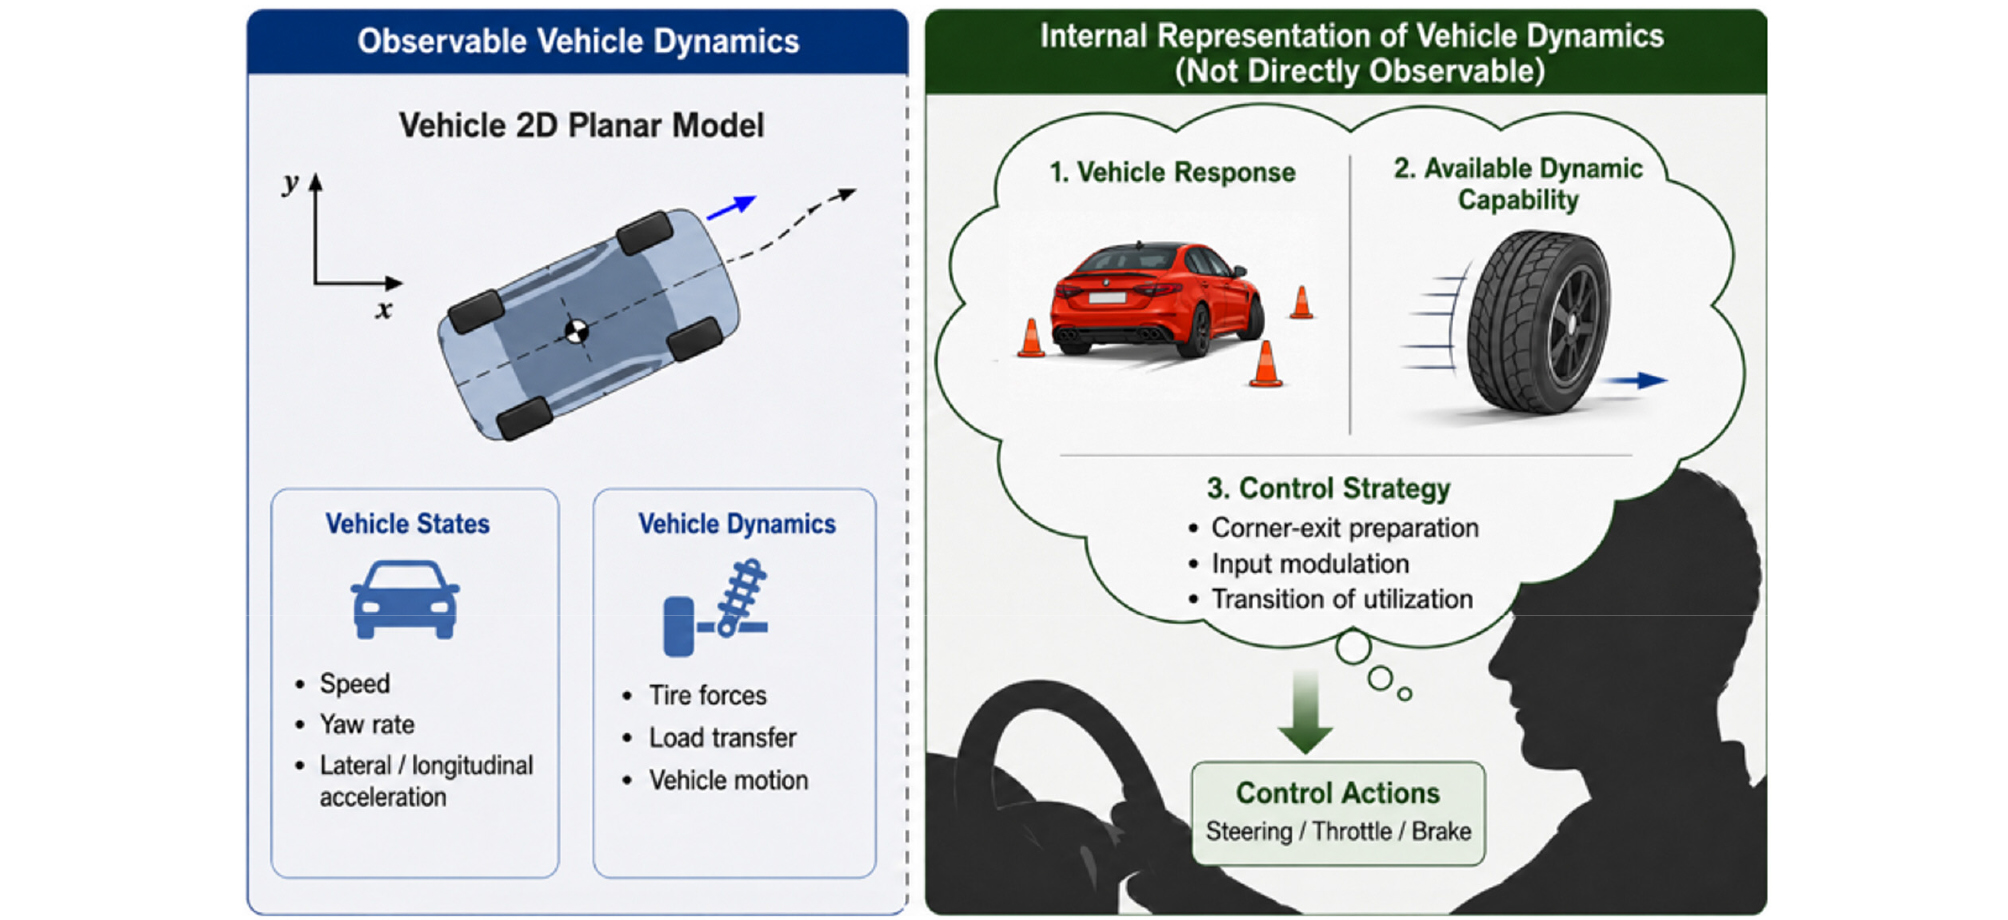
Since internal representations cannot be directly observed, the present study does not attempt to identify or quantify them explicitly. Instead, tire utilization characteristics and observable driving behavior are examined as indicators that may provide insight into how highly skilled drivers perceive and utilize vehicle dynamic capability.
2.3. Interpreting Tire Utilization Characteristics
The objective of this study is not to estimate tire forces or reconstruct detailed vehicle states. Instead, attention is directed toward how available vehicle dynamic capability is utilized during driving. From a driver perspective, vehicle dynamic capability is reflected through observable vehicle responses generated by steering, throttle, and braking actions. Consequently, longitudinal acceleration, lateral acceleration, vehicle trajectory, speed profile, and driver control inputs are considered useful indicators for interpreting highly skilled driving behavior.
Among these variables, the relationship between longitudinal and lateral acceleration provides a compact representation of how vehicle dynamic capability is utilized. For this reason, g-g diagrams are adopted as a primary tool for visualizing tire utilization characteristics. Rather than representing individual tire forces, g-g diagrams provide a vehicle-level description of acceleration capability and its utilization during driving.
The relationship between a g-g diagram and tire utilization can be understood from the friction circle concept. For the (i)-th tire, the combined longitudinal and lateral tire force is limited by the available friction force as :
where , , and denote the longitudinal tire force, lateral tire force, normal load, and tire-road friction coefficient, respectively. The corresponding tire utilization ratio can be expressed as :
Although the present study does not estimate individual tire forces, the vehicle-level acceleration response is related to the resultant tire forces. Under a simplified planar motion assumption,
Therefore, the point (, ) in the g-g diagram can be interpreted as an approximate vehicle-level representation of combined longitudinal and lateral tire utilization. In this study, this relationship is used only as an interpretive basis. The g-g diagram is not treated as a direct measurement of the tire force utilization at each wheel. Where denotes the longitudinal acceleration of the vehicle, corresponding to G Force Long in the measured data, and denotes the lateral acceleration of the vehicle, and denotes the vehicle mass.
Previous studies have shown that tire force utilization near the limits of handling exhibits systematic relationships with driving conditions and path curvature.(22) These findings suggest that highly skilled driving should not be interpreted solely in terms of peak acceleration values or maximum friction usage. Additional insight may be obtained by examining how vehicle dynamic capability is utilized throughout a maneuver. Therefore, the present study places greater emphasis on utilization characteristics, including the progression of acceleration states and their transitions during driving, than on maximum acceleration values alone.
To support this interpretation, an empirical tire utilization envelope is employed as a practical reference for available vehicle dynamic capability. The envelope is derived from accumulated driving data and is not intended to represent the physical limit under all operating conditions. Instead, it provides a qualitative reference for interpreting how drivers approach and utilize available vehicle dynamic capability during driving.
3. Pilot Study
A pilot study was conducted to examine how professional drivers with different performance levels utilize vehicle dynamic capability in sequential cornering scenarios. The purpose of this analysis is not to provide a statistically generalized evaluation of driver skill, but to investigate whether observable vehicle responses can provide useful insights into high-skilled driving behavior from a vehicle dynamics perspective.
The driving data were collected at the full course of Yongin Everland Speedway. All drivers used the same Hyundai Avante N race vehicle prepared for the Super Race GTA class, as shown in Figure 3. The vehicle was equipped with a MoTeC-based data acquisition system and a GPS-RTK system, which provided vehicle dynamic signals and trajectory information. The driving sessions were conducted under similar conditions, with ambient temperature approximately between 20 and 25°C. Hankook slick tires, used as the official tire for the Super Race series, were mounted on the vehicle, and the tire wear condition was at an intermediate level. Table 1 summarizes the characteristics of the three drivers analyzed in this study. All three drivers had professional racing experience, but differed in racing background, performance level, and representative lap time with the same vehicle.
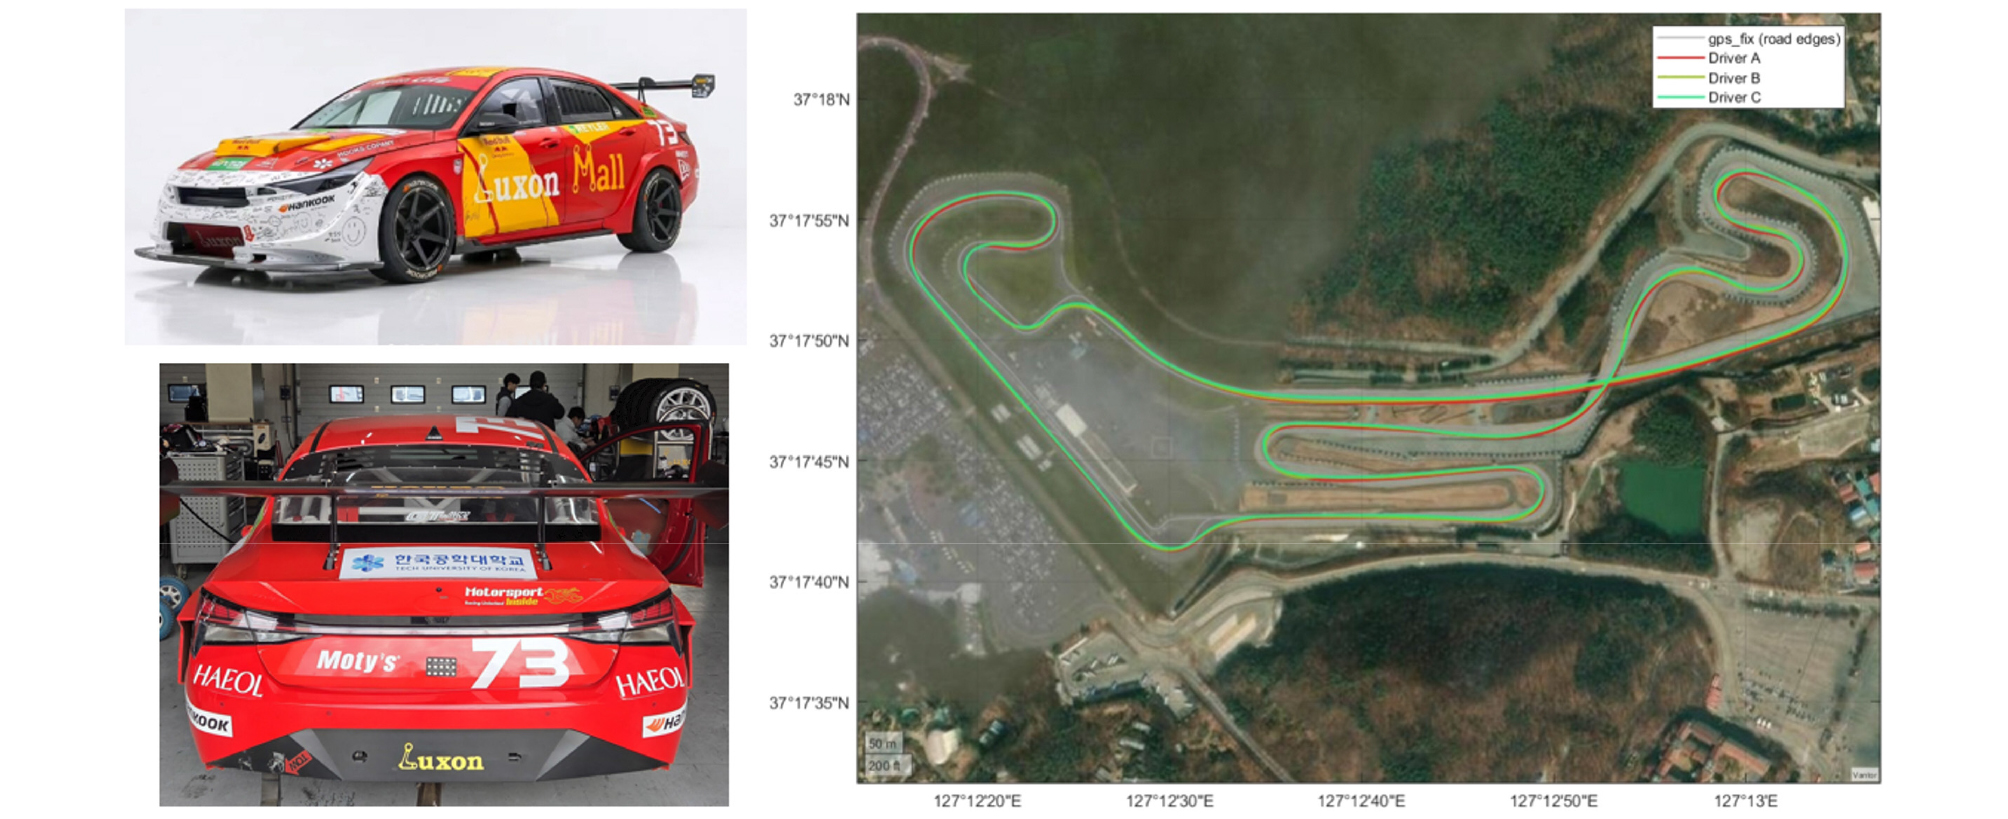
Table 1.
Driver characteristics used in the pilot analysis
Based on these data, the analysis focuses on selected sequential corner sections where differences in trajectory, speed profile, acceleration response, and control behavior can be observed. These sections are suitable for examining how drivers with different performance levels utilize available vehicle dynamic capability during corner entry, mid-corner transition, and corner exit.
3.1. Experimental Data
Everland Speedway consists of 17 corners with different geometric and dynamic characteristics. A full-lap analysis can provide a broad description of driver behavior, but selected corner sections are more suitable for examining driver-dependent differences in a focused manner. In this pilot study, representative sequential corner sections were selected to analyze differences in trajectory, speed profile, acceleration response, and tire utilization characteristics.
Two sections were selected for detailed analysis. The first section is Corner 13, which is part of a long sequential cornering segment. The second section is the Corner 16–17 chicane, located immediately before the main straight. These sections were selected because they require not only cornering performance at a local point but also preparation of the vehicle state for the following section. Therefore, they are suitable for examining how drivers with different performance levels utilize vehicle dynamic capability in sequential cornering situations. Figures 4 and 5 show the driving data for Corner 13 and the Corner 16–17 section, respectively. Each figure includes the vehicle trajectory, vehicle speed, lateral acceleration, longitudinal acceleration, and g-g diagram. The trajectory and speed profile describe the spatial and temporal characteristics of the driving line, while the longitudinal and lateral acceleration responses provide information on how the vehicle state changes during cornering. The g-g diagram is used as a vehicle-level representation of the relationship between longitudinal and lateral acceleration.
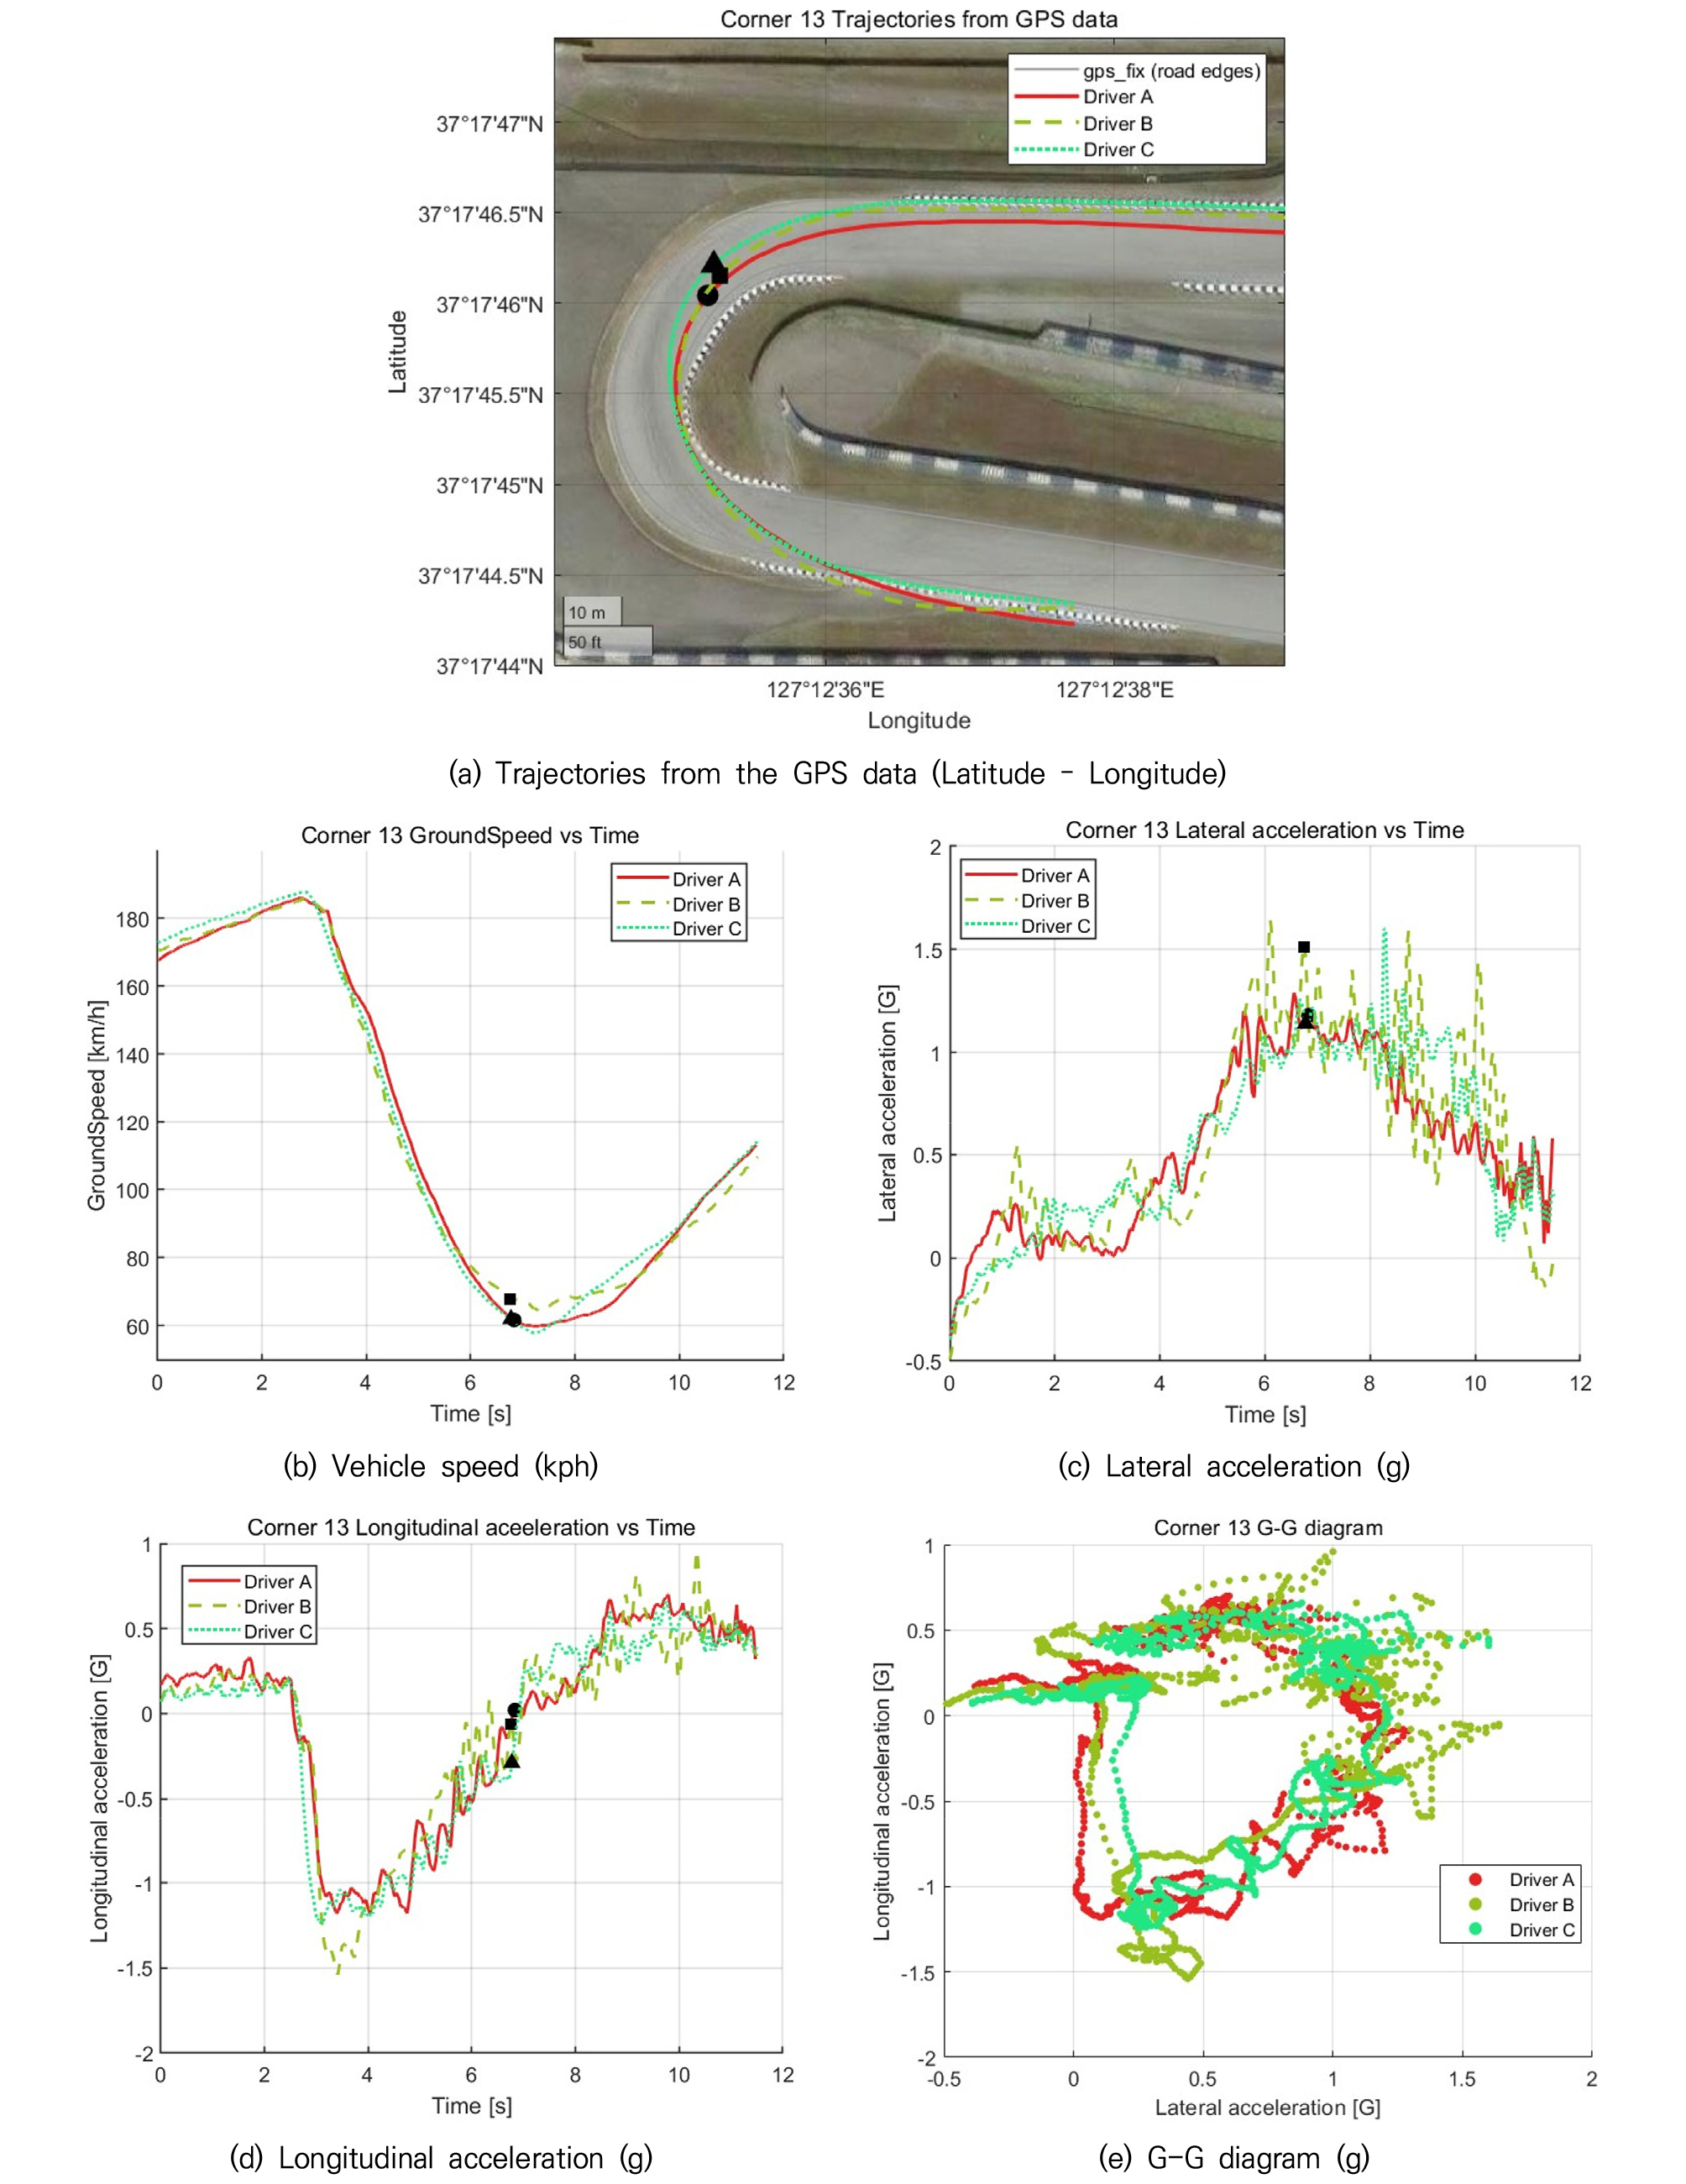
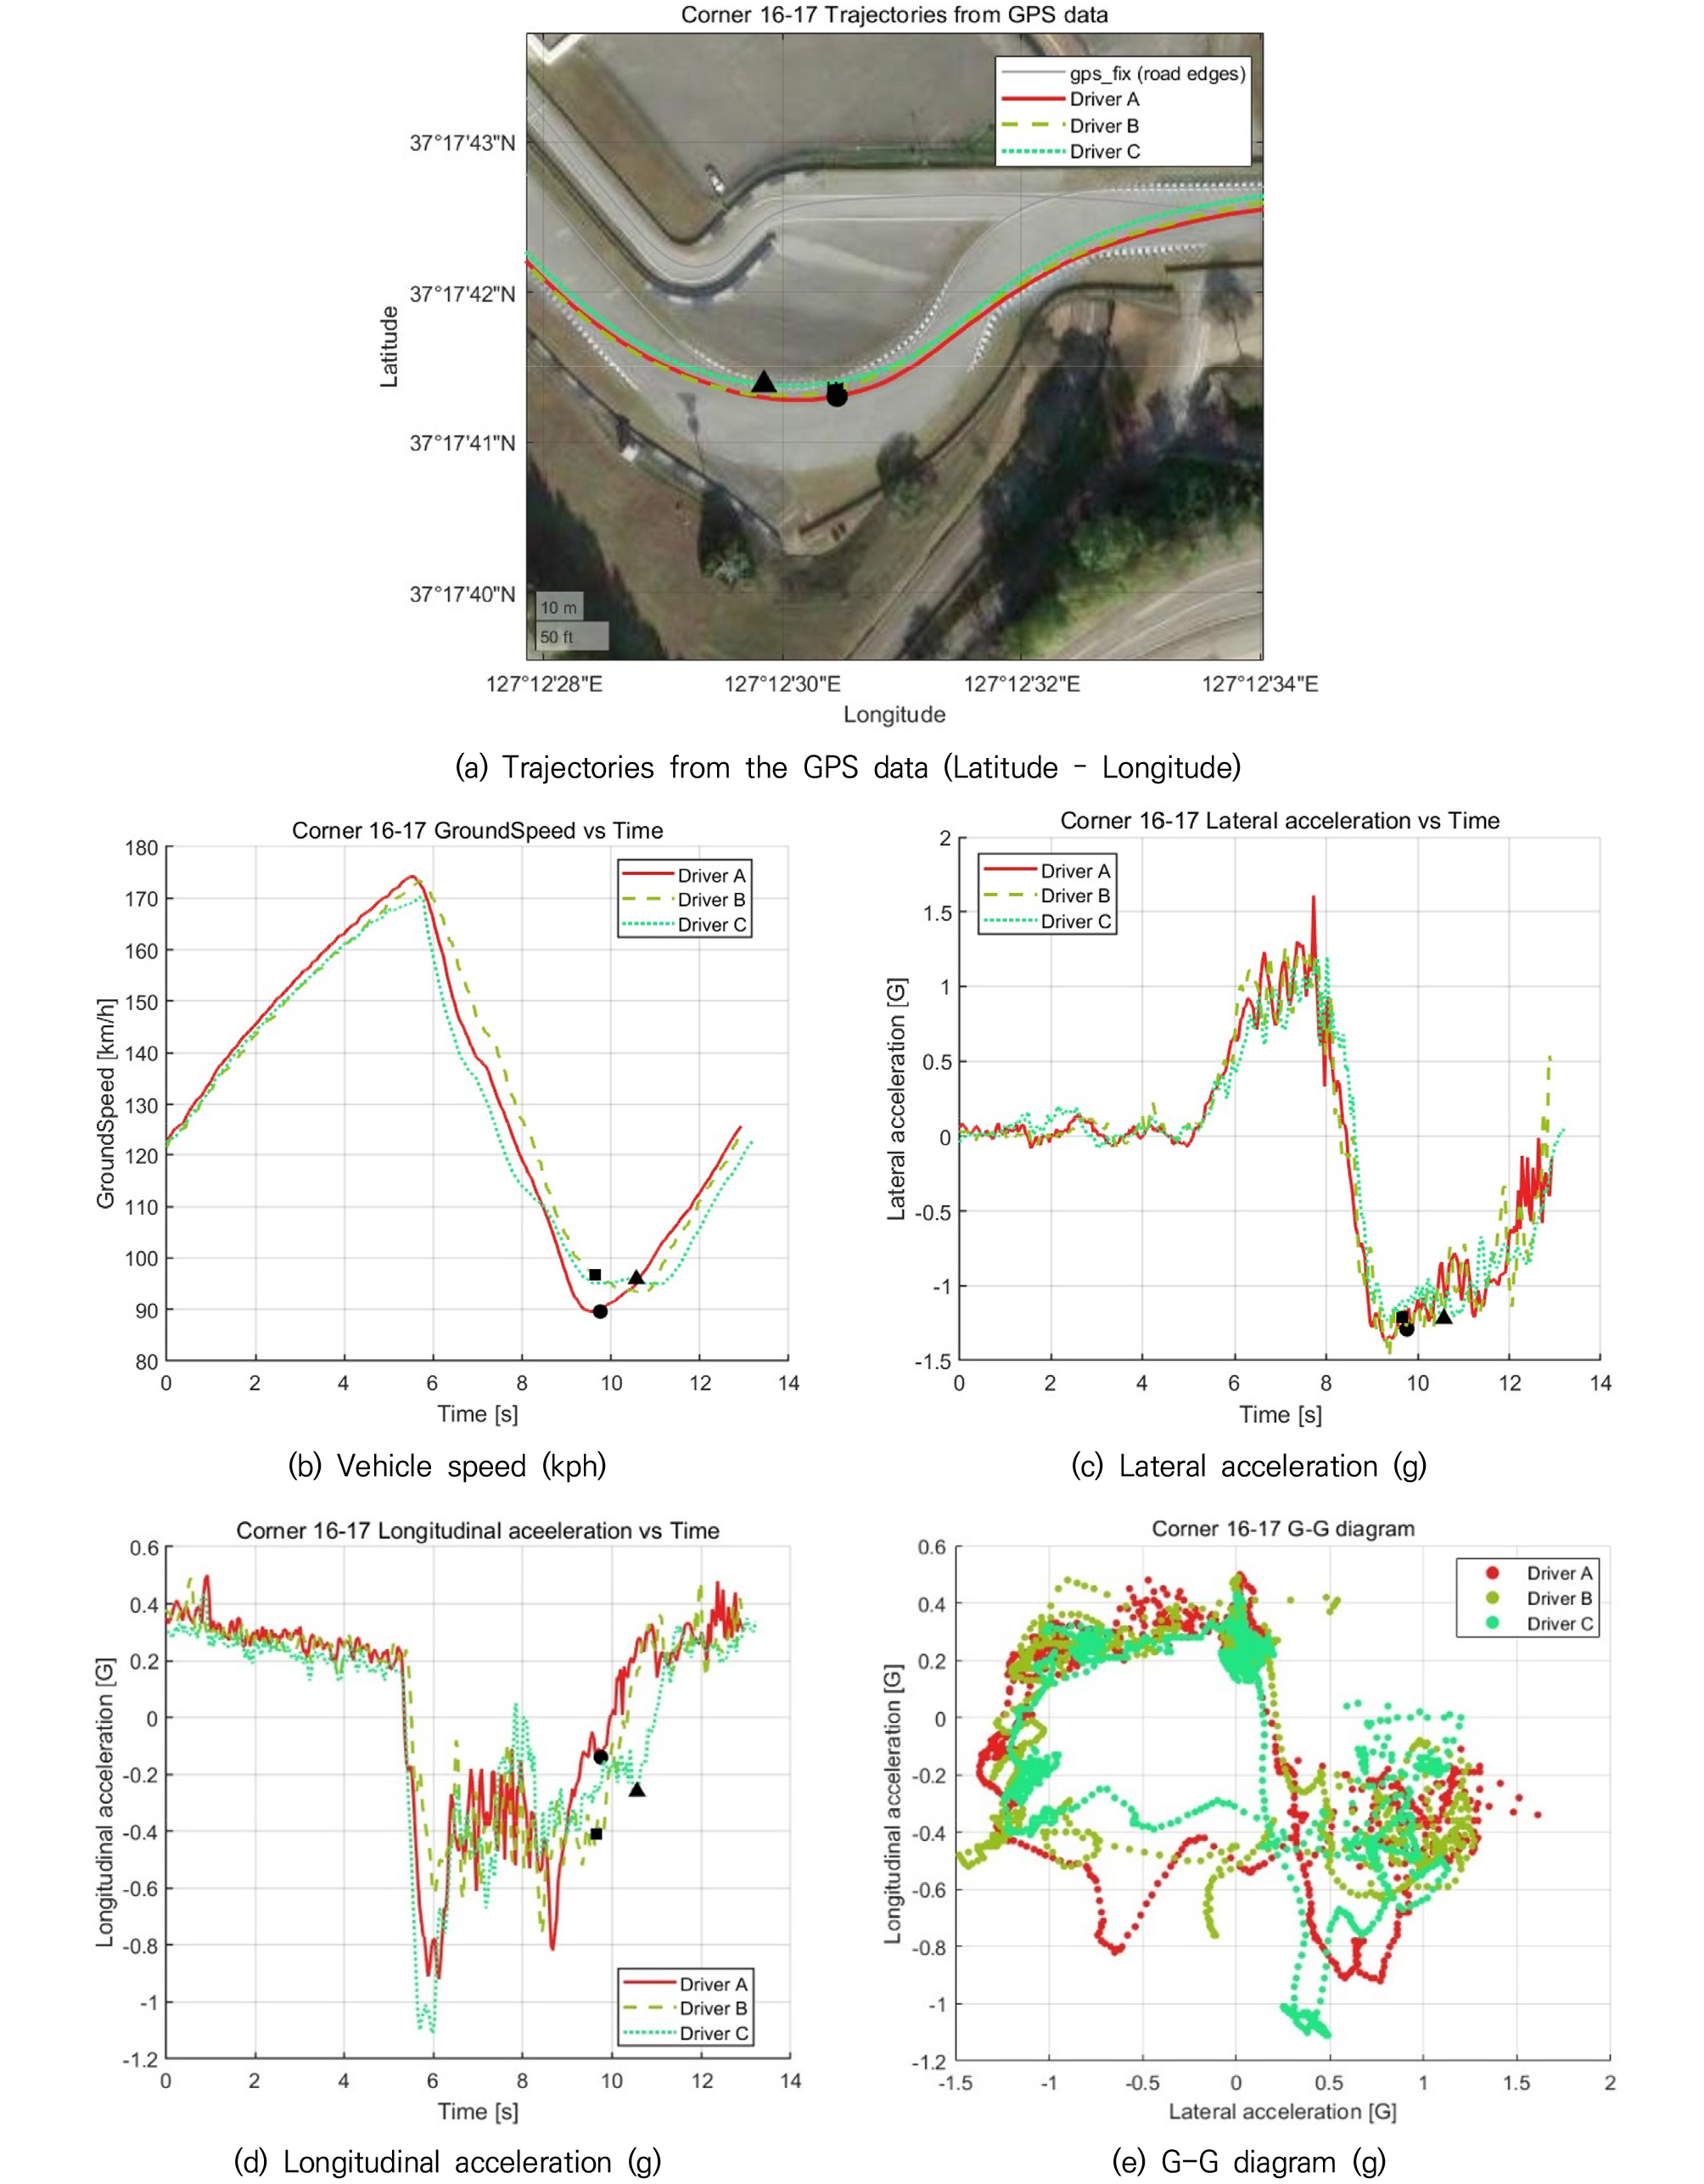
Fig. 5
The driving data for Corner 16-17 – (a) Trajectory, (b) Ground speed, (c) Lateral acceleration, (d) Longitudinal acceleration, (e) G-G diagram. Black markers indicate the re-acceleration onset, with circles representing Driver A, squares representing Driver B, and triangles representing Driver C
3.2. Interpretation Procedure
The interpretation procedure was designed to examine how vehicle dynamic capability is utilized during sequential cornering. The analysis does not treat a single variable, such as minimum corner speed, maximum lateral acceleration, or peak acceleration in g-g space, as an independent indicator of driving performance. Instead, these variables are interpreted together to examine how the vehicle state changes throughout the cornering maneuver.
In this study, the re-acceleration onset was identified from the Accel Pedal Pos signal as the point at which the driver began the main accelerator pedal input for corner exit. This point was used to examine how the vehicle state changed from corner entry through re-acceleration onset to corner exit.
The analysis was conducted in three steps. First, the vehicle trajectory and speed profile were examined to identify differences in line selection and speed management. Second, the longitudinal and lateral acceleration time histories were analyzed to observe how the vehicle state changes from corner entry through the re-acceleration onset to corner exit. Third, the g-g diagram was used to interpret how longitudinal and lateral acceleration were allocated during the maneuver. Since the selected sections include sequential corners and corner-exit situations, particular attention was given to the transition from lateral acceleration-dominant states to positive longitudinal acceleration. This transition was used as a key indicator for interpreting how each driver prepared the vehicle state for the following section. The detailed observations based on this procedure are discussed in Section 4.
4. Understanding High-Skilled Driving Through Tire Utilization Characteristics
This section examines the selected corner data to interpret differences in driving behavior among the three drivers. Since the purpose of this study is not to rank driver skill using a single metric, the analysis focuses on how trajectory, speed, acceleration response, and g-g characteristics are related to the use of vehicle dynamic capability.
Figures 4 and 5 show that the differences among the drivers are not sufficiently explained by minimum corner speed or peak acceleration alone. The following subsections therefore examine the data in terms of speed management, acceleration transition, and tire utilization characteristics during sequential cornering.
4.1. Trajectory and Speed Characteristics
The trajectory data in Figures 4(a) and 5(a) show that the three drivers followed broadly similar driving lines in the selected sections, although local differences can be observed during corner entry, around the accelerator pedal re-application point, and during corner exit. These differences indicate that each driver used a slightly different approach to positioning the vehicle through the sequential corner sections.
The speed profiles in Figures 4(b) and 5(b) show that Driver A, who recorded the fastest representative lap time, did not simply maintain the highest speed throughout the corners. In particular, the local minimum speed around the accelerator pedal re-application point was not consistently higher for Driver A than for the other drivers. This observation suggests that maintaining a higher minimum corner speed alone does not explain the performance difference among the drivers.
The more relevant difference appears after the minimum-speed region. In both selected sections, the speed profile should be interpreted in relation to the following acceleration phase rather than as an isolated minimum-speed value. This indicates that trajectory and speed characteristics provide only the first level of interpretation. To understand the performance difference more clearly, the acceleration transition from corner entry through the re-acceleration onset to corner exit should be examined.
4.2. Acceleration Transition from Corner Entry through Re-acceleration to Corner Exit
Figures 4(c), 4(d), 5(c), and 5(d) show the lateral and longitudinal acceleration responses in the selected corner sections. The black markers indicate the re-acceleration onset identified from the accelerator pedal input. In both sections, accelerator re-application occurred after the lateral acceleration had reached a high level and had begun to decrease. This indicates that the drivers generally initiated re-acceleration while reducing the lateral demand rather than waiting until the cornering state had completely disappeared.
In Corner 13, a similar transition pattern was observed for the three drivers. Lateral acceleration increased during cornering, reached its peak, and then began to decrease around the re-acceleration onset. After this point, longitudinal acceleration progressively recovered toward positive values as lateral acceleration decreased. Therefore, the re-acceleration onset represents the beginning of the transition from a predominantly lateral acceleration state toward a state in which longitudinal acceleration is progressively recovered.
A similar tendency was observed in Corner 16. However, differences among the drivers were more apparent in the vehicle state at which re-acceleration was initiated. In particular, Driver A initiated accelerator re-application at a relatively higher longitudinal acceleration level than Drivers B and C. Thus, the characteristic difference was not simply whether the accelerator pedal was applied earlier. Rather, Driver A began re-acceleration after the longitudinal acceleration had already recovered to a more favorable level while lateral acceleration was being reduced.
These results suggest that the acceleration characteristics of highly skilled drivers should be interpreted not only from the timing of accelerator re-application but also from the vehicle state at that timing and the subsequent transition between lateral and longitudinal acceleration. The selected sections show that re-acceleration begins during the reduction of lateral acceleration, followed by a progressive recovery of longitudinal acceleration toward corner exit. The differences among the drivers therefore appear to be associated with how this transition is managed rather than with a single peak acceleration value or the re-acceleration timing alone.
4.3. Tire Utilization Characteristics in g-g Space
Figures 4(e) and 5(e) show the g-g diagrams for the selected corner sections. These diagrams provide a vehicle-level representation of how longitudinal and lateral acceleration are combined during the maneuver. Based on the relationship between the friction circle and the g-g diagram discussed in Section 2.3, Figures 4(e) and 5(e) are interpreted as vehicle-level representations of tire utilization characteristics. The focus is not on estimating the tire utilization ratio at each wheel, but on examining how the acceleration state moves between lateral acceleration-dominant and longitudinal acceleration-dominant regions. The distributions in g-g space show that Driver A did not simply occupy a larger acceleration region than the other drivers. In other words, the higher performance of Driver A is not explained by a larger peak value in the g-g diagram alone.
The g-g diagrams are useful because they show the allocation between lateral and longitudinal acceleration. In the selected sections, the main difference among the drivers appears in the way the acceleration state moves through g-g space, rather than in the maximum value of a single acceleration component. This supports the view that tire utilization characteristics should be interpreted in terms of acceleration transition and state progression.
From this perspective, Driver A’s driving behavior can be understood as a more effective use of the available vehicle dynamic capability during the transition from cornering to acceleration. The data do not suggest that Driver A simply used more tire capacity throughout the corner. Instead, the observed g-g characteristics indicate that the timing and direction of the transition toward positive longitudinal acceleration are important for interpreting the performance difference.
These observations are consistent with the interpretation that tire utilization in high-skilled driving is not limited to maximizing instantaneous acceleration. In sequential cornering, the manner in which the driver moves the vehicle state from lateral acceleration to longitudinal acceleration provides useful information for understanding how vehicle dynamic capability is utilized.
4.4. Tire Utilization as a Build-Up Strategy for Corner Exit
The observations in the selected corner sections indicate that the performance difference among the drivers is not sufficiently explained by local speed or peak acceleration values alone. Driver A did not consistently show a higher minimum speed around the re-acceleration onset, nor did the data show a clearly larger maximum lateral acceleration or larger peak value in g-g space. This suggests that the main difference lies not in the amount of tire utilization at a single instant, but in how tire utilization is redistributed throughout the cornering process.
From a tire utilization perspective, the selected corner sections require a transition from lateral utilization to longitudinal utilization across the cornering process. During cornering, a large portion of the available tire capacity is used to generate lateral acceleration. Around the re-acceleration onset, lateral acceleration begins to decrease while the available tire capacity is progressively redirected toward longitudinal acceleration. Therefore, the timing and progression of this transition are important for interpreting high-skilled driving behavior.
In both selected sections, Driver A appears to reduce lateral acceleration and recover positive longitudinal acceleration more effectively throughout the transition from cornering to corner exit. This behavior can be interpreted as a build-up process for longitudinal tire utilization during corner exit. Driver A does not simply use a larger tire utilization envelope throughout the maneuver. Instead, the characteristic feature is the more effective transition from lateral tire utilization to longitudinal tire utilization across the cornering process.
This interpretation explains why a faster driver may not necessarily show the highest minimum speed, the largest lateral acceleration peak, or the largest occupied region in g-g space. In sequential cornering, high-skilled driving may be characterized by the ability to redistribute tire utilization over time throughout the cornering process so that longitudinal acceleration can be generated earlier for the following section. Thus, tire utilization characteristics provide useful information not only about how close the vehicle is to its dynamic limit, but also about how the driver prepares the vehicle for the following section.
5. Discussion
The pilot analysis provides a vehicle-dynamics-oriented interpretation of high-skilled driving based on tire utilization characteristics. The results do not indicate that the higher-performance driver simply used a larger tire utilization envelope or achieved higher peak acceleration values. Instead, the main difference was observed in how the available dynamic capability was organized during the transition from cornering to acceleration.
The following discussion summarizes the implications of this interpretation. First, the findings are discussed in terms of how high-skilled driving can be understood from a vehicle dynamics perspective. Then, a possible direction for formalizing this interpretation as a predictive control problem is introduced. Finally, the implications for driver coaching, human-inspired control, and future research are discussed.
Interpretation of High-Skilled Driving
The present findings suggest that high-skilled driving should not be interpreted only as the ability to drive closer to the vehicle limit at each instant. In the selected sequential corner sections, the higher-performance driver did not consistently show the highest minimum speed, the largest lateral acceleration peak, or the largest occupied region in g-g space. This indicates that local performance measures alone may not adequately explain high-skilled driving behavior.
A more relevant interpretation is that high-skilled driving involves organizing tire utilization over time. During cornering, available tire capacity is mainly used for lateral motion. For effective corner exit, this lateral demand must be reduced so that longitudinal acceleration can be generated. The higher-performance driver appeared to manage this transition more effectively, suggesting that skilled driving is closely related to the timing and progression of tire utilization rather than the instantaneous magnitude of utilization alone.
This interpretation is consistent with the concept of experience-based understanding of vehicle dynamics discussed in this study. The results do not directly identify the driver’s internal representation. However, they suggest that observable tire utilization characteristics can provide useful indicators for interpreting how a skilled driver may anticipate vehicle response and prepare the vehicle state for the following section.(23)
Possible Formalization of Tire Utilization Strategy
The interpretation proposed in this study may provide a basis for future modeling of high-skilled driving behavior. One possible direction is to describe the observed tire utilization strategy using an inverse optimal control or predictive control framework. This does not imply that human drivers explicitly solve an optimization problem. Instead, the purpose is to represent the relative importance of different driving objectives in a structured form. Skilled human control may rely on prediction, feedback correction, and adaptation of internal representations through repeated interaction with dynamic systems.(24,25)
For example, the driver’s behavior over a sequential cornering section may be approximated by a weighted objective such as :
In this expression, (T) represents the section time, () represents trajectory deviation, () penalizes excessive speed loss, and () represents control smoothness. The final term, (), represents the recovery of positive longitudinal acceleration at corner exit. The weights (), (), (), (), and () determine the relative importance of section time, trajectory tracking, speed maintenance, input smoothness, and corner-exit acceleration recovery, respectively. In a predictive control formulation, minimizing this objective would provide the control input sequence (), which consists of steering, throttle, and braking commands over the selected cornering section. Track boundaries, input limits, vehicle dynamics, and tire utilization constraints in g-g space may be treated as constraints in this formulation.
From this viewpoint, the findings of the present study suggest that higher-performance drivers may place greater relative importance on corner-exit acceleration recovery than on local minimum speed or instantaneous peak acceleration. Although the present study does not identify these weights directly, this formulation illustrates how the proposed interpretation could be extended toward expert driver modeling, driver coaching, and human-inspired vehicle control.
Implications for Driver Coaching and Human-Inspired Control
The proposed interpretation has practical implications for driver coaching. Conventional coaching often relies on lap time, speed profile, braking point, throttle timing, and racing line. These indicators are useful, but they may not fully explain why a faster driver achieves better performance in sequential cornering. The present results suggest that coaching feedback should also consider how tire utilization changes over time, especially the transition from lateral tire utilization to longitudinal tire utilization following the re-acceleration onset.
From this perspective, a driver coaching system could provide feedback not only on whether a driver maintained sufficient corner speed, but also on whether the driver prepared the vehicle state for corner exit. For example, delayed recovery of positive longitudinal acceleration may indicate that the driver maintained excessive lateral demand following the re-acceleration onset.
Such feedback could help drivers understand that faster cornering is not always achieved by increasing minimum speed or peak lateral acceleration, but by organizing vehicle dynamic capability more effectively across the cornering sequence.
The findings are also relevant to human-inspired vehicle control. Many automated driving and racing control algorithms aim to reproduce expert trajectories or minimize lap time directly. However, expert-like behavior may require more than trajectory imitation. The present study suggests that the temporal organization of tire utilization is an important characteristic of high-skilled driving. Therefore, human-inspired controllers may benefit from considering how expert drivers allocate vehicle dynamic capability between lateral and longitudinal motion, particularly during corner exit.
For expert driver modeling, the proposed perspective provides a useful intermediate representation between raw driving data and control strategy. Instead of modeling only steering, throttle, or braking inputs, expert driver models may incorporate tire utilization characteristics, acceleration transition, and corner-exit preparation as interpretable features. Such features may help develop driver models that reproduce not only the observable trajectory, but also the underlying vehicle-dynamics-oriented strategy of skilled drivers.
Limitations and Future Work
This study has several limitations. First, the analysis was conducted as a pilot study using data from three professional drivers and selected sequential corner sections. Therefore, the findings should not be interpreted as a statistically generalized description of all high-skilled drivers. Second, the analysis focused on vehicle-level responses, including trajectory, speed, longitudinal and lateral acceleration, and g-g characteristics. Individual tire forces, tire-road friction coefficients, and detailed tire utilization ratios at each wheel were not directly estimated. The empirical tire utilization envelope was used only as a qualitative reference, not as a precise physical limit under all tire, road, and thermal conditions.
Another limitation is that the proposed predictive-control-based interpretation was not quantitatively identified in this study. The weighting factors in the illustrative objective function were not estimated from data, and the corresponding optimization problem was not solved. Therefore, the discussion should be understood as a possible modeling direction rather than a validated driver model. Future work should include larger datasets with more drivers, repeated laps, additional corner types, and different tire and road conditions. Such data would allow more systematic analysis of driver-dependent tire utilization characteristics and their relationship to performance.
Future research may also extend the proposed interpretation toward data-driven driver modeling. By combining vehicle response data, control inputs, and tire utilization characteristics, it may be possible to identify driver-specific weighting structures or control strategies using inverse optimal control, imitation learning, or predictive control approaches. This would be useful for driver coaching systems that provide feedback not only on speed and trajectory, but also on how tire utilization is transitioned during cornering.
The proposed perspective may also contribute to human-inspired vehicle control and autonomous driving agent research. Expert driver models based on tire utilization characteristics could help automated systems reproduce not only expert trajectories but also expert-like use of vehicle dynamic capability. More broadly, the idea of interpreting expert behavior through observable dynamic responses may be relevant to studies that learn from skilled human operators and transfer their strategies to intelligent machines, such as collaborative robots and humanoid robotic systems. In this sense, the present study provides an initial step toward understanding high-skilled human control behavior in dynamic systems and translating such behavior into interpretable modeling and control frameworks.